In order to establish any type of proof of electronic voter fraud, you first have to look at anomalies and irregularities in vote patterns. That means you need to see a repetition of information that appears to skew one way or the other. As Dr. Frank did in his analysis of “electronic vote stuffing” by adding ballots according to a predetermined algorithm and the determining a “key” to predict voter turnout exactly, looking at other patterns that seem to suggest some form of data manipulation in the vote totals. To that aim, a report was produced by Seth Keshel for the Texas Lieutenant Governor’s Task Force on Election Fraud titled, “Report on Suspicious Voting Patterns in Texas.”
Looking at the 2020 Election data, Trump improved over his 2016 performance in 158 counties throughout Texas. Looking at how Mr Trump performed he increased his voter base in traditional Democrat strongholds in the states: Hispanics, suburban White women, Blacks, and blue collar White men. So, the question has to be asked: If Trump gained in traditional Democrat strongholds, where did Biden improve? Republicans? I do not think so, and neither does the data.

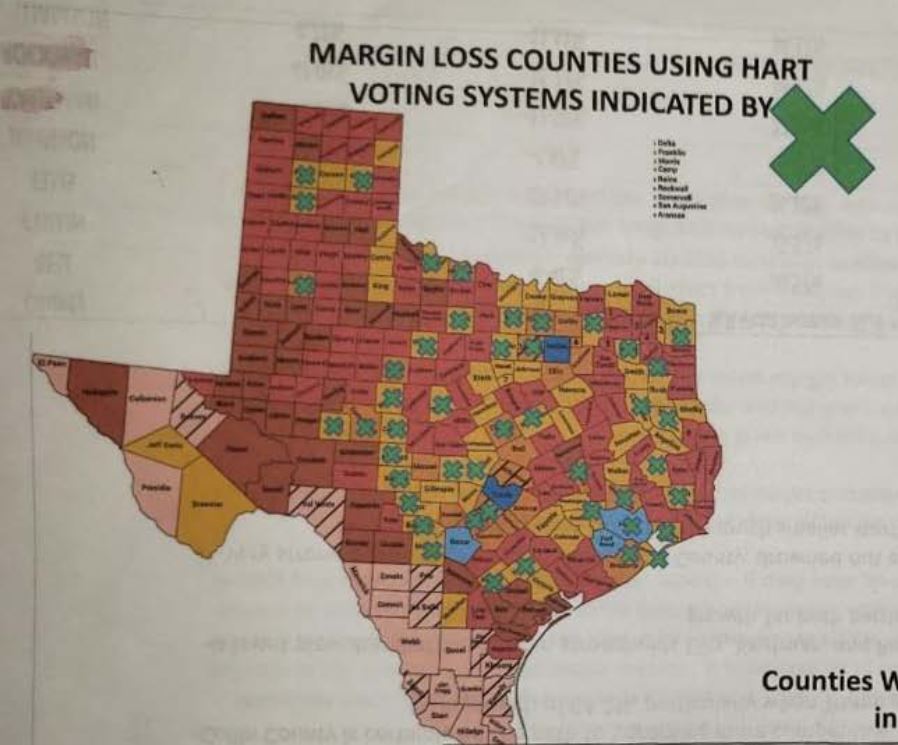
So, let’s explore this in a little more detail. If you look at the State of Texas, one of the anomalies that stands out is that in EVERY county that was operating a Hart Intercivic voting system, that Trump lost margins from 2016 compared to 2020. Notice the green X’s in the map below. This is just not a coincidence, it is an impossibility. Remember, Trump IMPROVE his performance across al traditional Democrat demographics, so how did Bide do this? Think phantom voters as I describe here.

Finally, you need to look at the past to understand the present. Below is a table of how Trump performed in the 2016 Presidential Election compared to the 2020 election. In 2016, Trump was running against Hillary Clinton and in almost every county, he beat Clinton by a substantial margin. Remember, there was an election steal going on in 2016 too, but Clinton thought (erroneously) that there was no way Donald Trump could possibly beat her.
Now, lets move to 2020. Looking at the table below, notice that in these counties with HART Intercivic machines, that Trump actually increased his voter turnout substantially, but Biden, the guy who did NO campaigning and did not visit Texas once, actually did BETTER that both the historic highs of both Hillary Clinton (2016, first female candidate) and Barrack Obama (208; first black candidate) in getting more Democrat votes out. Both Clinton and Obama were historic candidates in their own right and of course you would expect to see an increase in Democrat turnout, but for Biden to not only go above, but essentially double these historic candidates turnouts leaves one to pause. This just does not happen unless there is foul play at hand. The big red flag is Tarrant the deep red Tarrant county, flipping18.5 point in Biden’s favor. That just did not happen organically.
Statistically, this is an impossibility considering in counties without HART Intercivic machines, there was no appreciable increase in turnout of Democrats throughout Texas. The increase in Democrat voters in these 12 counties amount to 344,568. Even accounting for historic highs in turnout for these Counties, at least 190,000 votes are just fabricated out of thin air. So, it is pretty easy to see how 1.1 million phantom votes could have been cast in Texas as there 254 counties. The only conclusion one can reach is that these machines’ tabulation was tampered with and must be audited to see if Phantom voting was in play. This audit should also includie canvasing these counties.Until that is done, questions will continue and distrust in our elections will persist. Again, we must eliminate the ability of anyone to manipulate voting totals in Texas en mass, and that means elimination of electronic voting of any kind in Texas.

